Draw timing

Hi Chris!

In a simple script that just runs one dynamic stimulus (either drifting grating or dynamic random dots), I noticed some glitches in the movement that sometimes occur. It is very hard to see at first, but it made me analyze the timestamps of the ‘#announceStimulus’ and ‘#stimDisplayUpdate’ events.

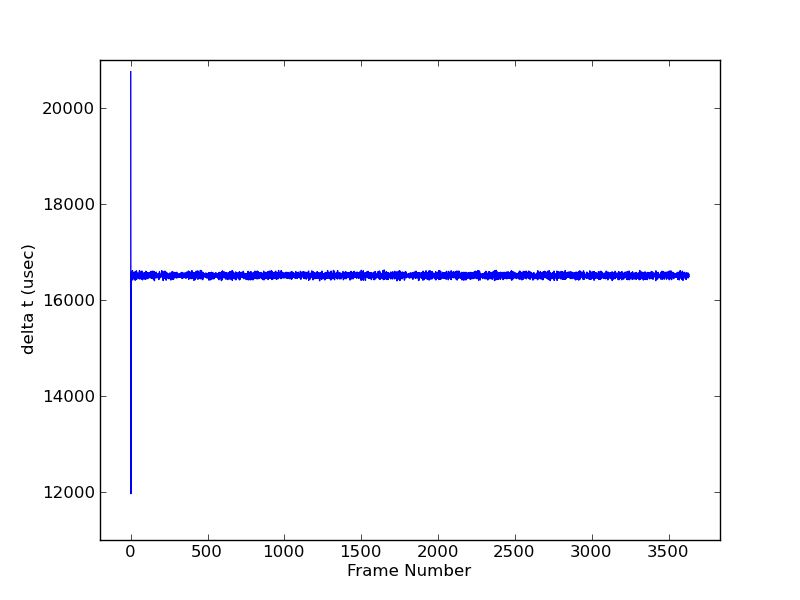
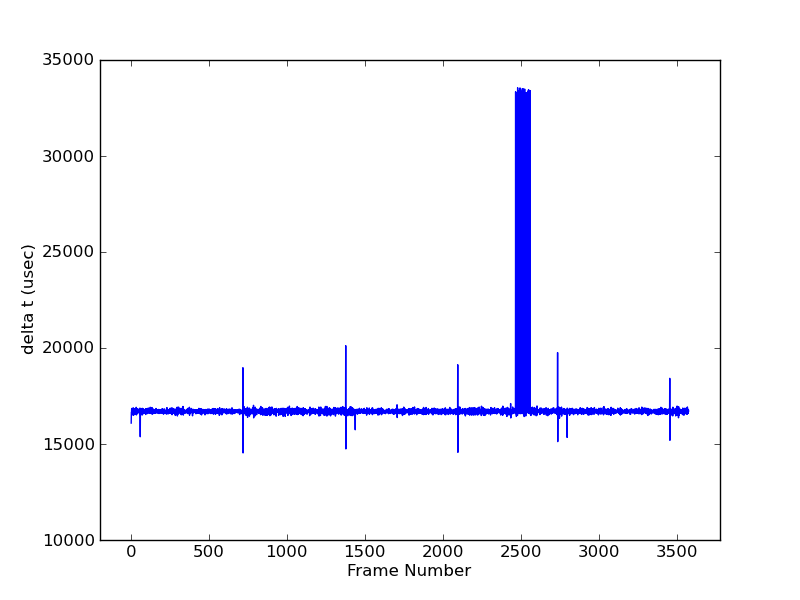
Apparently, one or two frames are being updated too early or too late and that causes the movement to be not uniformly because the dot- or grating-speed varies quite a bit. Attached to this message you can find a graph that shows event number versus event time for the ‘#stimDisplayUpdate’ in blue and the ‘#announceStimulus’ events for the background and the dynamic stimulus (in this case a grating) in red.

As one can see, there is one rather long and one (incredible) short delay between two updates. If this (Understanding display update time stamps / Timing / Knowledge Base - MWorks Support) is true, this would mean that the vertical blank period (VBL) is not regularly timed, which should absolutely not be the case. To test for that anyway, I ran the script on a mac with a precision TFT that guarantees proper vsync-timing and found the same error. There is also no additional load to the system while it runs the script. Furthermore, I can see no regularities in the occurrence of the issue.

I was wondering whether this behavior has anything to do with the value one sets for the frame-rate in the configuration of the dynamic stimulus, or with the value for the display refresh rate that is defined in the configuration file. Both settings do not seem to have anything to do with the issue. The frame-rate for the dynamic stimulus can be set to equal the display refresh rate, or to a much higher value (e.g. 500hz) to replicate the behavior one can see in the attached graph. If it is set to a lower value than the display refresh rate the update rate decreases, but you still see the glitches. The setting in the configuration file for the server application does not seem to have any effect at all.

I spend the last two days trying to fix the problem myself, but it seems like the core code is a little too advanced for me. However, I believe that the problem gets a little better when the framerate of the monitor is not truncated to an integer in the StandardDynamicStimulus section, especially when I run the program with the precision monitor (obviously because it’s framerate is not 60Hz). Apart from that I found nothing else that could cause the error.

Oh… and of course everything happens with both the 0.4.5 release and yesterdays nightly build. I hope you can reproduce it!

Thank you,
Philipp

Attachment: drawtiming.jpg (10.1 KB)

Hi Philipp,

I haven’t had a chance to investigate this in great detail, but I did want to send you a quick response before I leave for the weekend.

If you’re seeing glitches in the animation of dynamic stimuli, I would strongly suspect one of two causes:

  1. The video hardware isn’t drawing fast enough to keep up with the display refresh cycle.
  2. The frame rate setting for the dynamic stimulus is incompatible with the display’s refresh rate.

Checking for cause (1) is actually very easy, so long as you’re willing to recompile the MWorksCore framework. In the mw_core repository, open the file Core/Stimuli/StimulusDisplay.cpp, find the method StimulusDisplay::displayLinkCallback, and uncomment #define WARN_ON_SKIPPED_REFRESH. Then, recompile MWorksCore, and try running your experiment. If the graphics hardware isn’t keeping up, you’ll see warnings in the server console window of the form “Skipped XX display refresh cycles”.

As for cause (2), here’s what’s happening: MWorks display updates are tied to the display’s refresh cycle. Every refresh cycle, a dynamic stimulus is given the opportunity to redraw itself. Suppose the display’s refresh rate is exactly 60Hz. If the dynamic stimulus’ frames_per_second parameter (fps) is 60, then it will redraw at every refresh. If fps is 30, it will redraw every two refreshes. If fps is 20, it will redraw every 3 refreshes. And so on. (Note that if fps is any value greater than 60, then the stimulus will redraw at every refresh and no faster, since that’s the most often it can physically be redrawn.)

An fps that divides evenly into the refresh rate is what I mean by a “valid” frame rate. A frame rate that does not divide evenly into the refresh rate is “invalid” because redraws will happen at inconsistent intervals. For example, if the display’s refresh rate is 60Hz, and the stimulus’ frame rate is 40, then half of its frames will be displayed for one refresh period, and the other half will be displayed for two. This mismatch can produce very obvious jitter in the animation. (If the rates are less mismatched, e.g. 61Hz and 60fps, then the jitter will be less obvious, but still present.)

In addition, I think you’re right that we shouldn’t be truncating non-integer refresh rates, although I need to think about it some more. Also, you’re correct that the refresh_rate_hz setting in setup_variables.xml does nothing (as noted in Configuring MWorks).

I hope this is helpful. I’ll look in to this more on Monday.

Chris

Hi Chris,

Thank you for your fast response!

As you suggested, I will recompile MWorks with the debug flag first thing on monday. However, I believe that my system (16 core mac pro with radeon 5780) should be sufficiently fast. I can also see no difference of this system compared to a macbook pro.

As for cause 2, I am seeing the issue even though I set the frame rate for the dynamic stimulus to 500hz. If I understand you correctly, then this should result in a guaranteed redraw on every frame (although it throws a warning each time I start the stimulus).

Also, what is particularly odd is that my datafiles contain #announceStimulus’ and ‘#stimDisplayUpdate’ events that occur only about 1ms after the previous redraw (see graph). If the information in the datafile is true, I would thus have two screen redraws within 1ms, which I don’t believe is really the case.
If you think it is worth trying, I could set up a small testing environment with a photo-diode and oscilloscope to check if there are any irregularities in the screen flicker. For that, however, I would need a dynamic stimulus that changes the luminance of the screen (e.g. white vs black background) on every frame.

Thank you,
Philipp

Hi Chris,

I managed to compile the current source repository with the suggested debug flag. It installs just fine but the server cannot load the drifting_grating plugin. The loading fails with error reason: No factory for object type: stimulus/drifting_grating.

The plugin is located in /Library/Application Support/MWorks/Plugin/Core so I don’t see an immediate reason for it to fail loading. Is there any other dynamic stimulus that actually works with the current version of the source? It seems like a lot has changed since the 0.4.5 release in the way stimuli are constructed, so I am not able to fix the dynamic random dots plugin on a short notice. Maybe you are able to send me a compiled version of MWorks with the WARN_ON_SKIPPED_REFRESH flag enabled ?!
Meanwhile, I will stick to the notion that I find it very unlikely that my graphics hardware is causing the issue.

Thank you!
Philipp

Hi Philipp,

I believe that my system (16 core mac pro with radeon 5780) should be sufficiently fast.

I wouldn’t be so sure. My system has two Radeon 5770’s, and it’s not hard to make it miss a refresh – even something as simple as dragging a window around can do it. Also, regardless of how good the hardware is, the performance of graphics driver software on Macs is often far from optimal. I think there’s plenty of room for the graphics stack to be the culprit.

Also, what is particularly odd is that my datafiles contain #announceStimulus’ and ‘#stimDisplayUpdate’ events that occur only about 1ms after the previous redraw (see graph). If the information in the datafile is true, I would thus have two screen redraws within 1ms, which I don’t believe is really the case.

Yes, that is very strange. How often is this happening?

I managed to compile the current source repository with the suggested debug flag. It installs just fine but the server cannot load the drifting_grating plugin. The loading fails with error reason: No factory for object type: stimulus/drifting_grating.

Yeah, at this point, you’d probably need to check out all the MWorks repos and recompile from scratch in order to get a working build. Rather than asking you to do that, I think the right approach is to add a new system variable that controls whether the skipped-refresh warnings are displayed. I’ll try to do that today and get it into the nightly build, so you can try it.

Chris

I think the right approach is to add a new system variable that controls whether the skipped-refresh warnings are displayed.

This is done and will be in tonight’s nightly build. The variable is #warnOnSkippedRefresh, and it defaults to 0 (no warnings). To enable the warnings, change its value to 1 (via the client’s variables window).

It’d be interesting to know if the animation glitches and/or the too-short display update intervals correlate with skipped refreshes.

Chris

Hi Chris,

I did the above mentioned test run with a drifting grating, #warnOnSkippedRefresh turned on. First, I let the routine run for 60 seconds without doing anything to the test computer (in this case it’s my work box iMac G7). There were no warnings for skipped refresh cycles. After that I started again a 60 seconds reading, but this time I dragged windows around. It was not very easy to get it to loose frames, but a couple of warnings turned up.

You can see the results on the attached graph. It shows you the times between refreshes, for both the 60 seconds of test data. As you can easily see, the occurrence of a glitch that is caused by a skipped refresh is very different from the type of glitch I mean.

In this case I set the “frames_per_seconds” parameter for the drifting grating stimulus to 500. There was absolutely no difference when the setting was 60 (data not attached), and in this case there was no warning for an incompatible display refresh rate. So it’s not that either. With a setting of 30 fps the typical time between two refreshes doubled (as expected) but it changed nothing to the glitches.

For what it’s worth, it seems to me that MWorks is trying to draw two times within one VBL period. After it did that, it “looses” a refresh cycle because the video hardware is already busy drawing the previously queued frame (but this is not a skipped refresh). The dynamic stimulus, however, gets first a very short time reading and thus adjusts the dot- or grating-speed for one frame which is then shown on the screen a lot later. The next frame will have a long time reading and thus again a different movement speed of the stimulus. This would then cause the glitch.
At least that’s my current theory.

Hope we can solve this, if you need more information please let me help you!
Philipp

Attachment: lostandnolost.jpg (62 KB)

Hi Philipp,

Thanks for the additional data. Just for completeness, can you send me the experiment file you’re using to get these results?

My own test results don’t show the issue you’ve been describing. I’m seeing the time between refreshes occasionally double, but I never see the ultra-short periods that you’ve observed.

For what it’s worth, it seems to me that MWorks is trying to draw two times within one VBL period. After it did that, it “looses” a refresh cycle because the video hardware is already busy drawing the previously queued frame (but this is not a skipped refresh). The dynamic stimulus, however, gets first a very short time reading and thus adjusts the dot- or grating-speed for one frame which is then shown on the screen a lot later. The next frame will have a long time reading and thus again a different movement speed of the stimulus. This would then cause the glitch.

That makes a lot of sense. But it’s surprising if true, because the MWorks display-driver code is written explicitly to prevent that from happening. Specifically, we refuse to start rendering the next frame until the current back buffer is swapped and becomes the front buffer; since buffer swaps are configured to occur only during the vertical blank, this should ensure that we only draw once per display refresh. But your data do strongly suggest that MWorks is in fact drawing twice during some refresh cycles.

I suppose this could be a driver glitch that affects the Radeon 5780 but not the 5770. Or perhaps the connection to the display is flaky, and the VSYNC’s are being dropped somehow. (Out of curiosity, how is your monitor connected? DVI? Mini DisplayPort? VGA via an adaptor?) Perhaps more likely, the MWorks display code may be failing to prevent draw-ahead in all situations. I’ll keep looking…

Chris

Hi Chris,

I attached the experiment to this post. In order to see a typical timeline of the type of glitch I am describing, you have to look at frames other than 1 to ~5 after stimulus start, because they always have timing issues (this is a separate issue that should also be solved but should not be part of this discussion).

I see the issue on a Mac Pro with a 5780, on an iMac G7 with a 5750 and on a MacBook Pro. The Mac Pro has a precision TFT connected via DVI (MiniDispay adaptor), the iMac a normal TFT (Dell) connected via DVI (MiniDisplay adaptor) and the MacBook has and Apple Cinema Display connected via Mini DisplayPort (but the experiment runs on the MacBooks’ screen).

I suggest that the most probable explanation for the problem is not the Mac graphics driver, considering the variety of systems I tested. It could, however, be something general to Snow Leopard (all systems run 10.6.). Right now, for me at least, everything points to a bug in the MWorks code.

Thanks,
Philipp

Attachment: _timing.xml (1.8 KB)

Well, I’m stumped. I’ve run your experiment on two very different systems:

  • a Mac Pro with two ATI Radeon HD 5770’s, each driving a single LCD connected directly via DVI and running at 61Hz
  • a Mac mini with a NVIDIA GeForce 9400M, driving a LCD connected via DVI-to-mini-DVI adaptor, and a CRT connected via VGA-to-mini-DisplayPort adaptor (used for stimulus display); both displays run at 60Hz

Both systems are running Mac OS X 10.6.7 and have the latest MWorks nightly installed. On both systems, MWorks is configured to show stimuli on the secondary display, with a mirror window on the primary display.

I’ve attached the raw data files and plots showing the time between #stimDisplayUpdate events for both systems. I’ve also attached the Python script I used to generate the plots, so you know exactly how I got them.

As you can see, neither plot shows the behavior you’ve observed. On the Mac Pro, something weird happens with the first few events, but after that the timing is rock-steady. On the Mac mini, there’s a cluster of double-length intervals (corresponding to some missed display refreshes), as well as a few other glitches where a slightly too-long interval is followed by a slightly too-short one (the opposite of the issue you’re seeing). However, I don’t see a single instance of the ultra-short intervals that appear in your data.

I also performed many variations of the test:

  • no mirror window
  • mirror window only
  • stimuli on primary display
  • MWServer running in 32- and 64-bit modes
  • no waiting for buffer-swap completion
  • no syncing buffer swap to vertical blank

In no case did I get data that look like yours.

If you’d like to send me a data file that demonstrates the timing problem, I’ll take a look at it and see if it provides any hints as to what’s going on. Unfortunately, until I can reproduce the problem, I won’t be able to do anything about it.

Chris

Attachments:

Sorry, forgot to attach the Python script.

Attachment: plot_times.py (823 Bytes)

Hi Chris,

that’s really odd and I am totally puzzled about your results.

So I took one of our setups, reinstalled the OS (10.6.7) and put the current nightly build on it. This system has one ATI Radeon HD 5780 with a standard TFT running at 60Hz (the primary display) and one precision TFT running with ~59.875Hz (recognized as 60Hz) as the second monitor. The primary monitor connects directly to the graphics cards’ DVI port, the precision TFT connects via a miniDisplayPort to DVI adaptor. MWorks was configured to display the experiment on the second monitor (precision TFT) and a mirror window was displayed on the primary screen.

I ran the test experiment three times. The results were a little different from what I reported previously. I encountered bursts of skipped refresh cycles (see data files), but also irregularities in the draw timing without skipped refreshes. In one run, I had no errors at all, in another run the errors occurred in bursts, in yet another run it seemed to be unsystematically. On this machine I did not find the ultra-short intervals that I reported for the iMac, but I did find shorter and longer intervals that are fairly unregular.
It’s also not the case that the type of glitch I am reporting necessarily begins with a short and then a long interval. It’s just the usual thing that happens, but I’ve also seen first the long interval and then the short afterwards. This didn’t happen for the first time, I had that in my iMac data before but didn’t explicitly cut it out in the graphs (even though there is one example in the lower right graph of “lostandnolost.jpg”).
So it’s basically the same problem but a little less pronounced on this MacPro and even less on your MacMini system.

So I would say that you did reproduce the issue in the MacMini system, even though I am surprised by your results, since they are much better than mine.

Now I don’t know what’s the right thing to do, but I decided to build a setup that is comparable to your 2x 5770 macpro system which is performing great. For that I am going to modify the ATI Radeon HD 5780 MacPro and put a second graphics card in. This one will then display everything system related while the experiment will have not only its own screen but also its own graphics card.

This will take some time, but I will report back as soon as I have new data.

Also, I attached all the data files that I collected during my testing. In the zip-archive you find some files with a “setup3” prefix. Those are from the MacPro with the precision TFT that I described above. All other data files are from my iMac and show the ultra-short timings. Usually I configured the server via the client (mainly to set the debug flag). In the data files with the suffix “wo_client” I used only the server and an additional variable assignment in the script to set the debug flag. For the MacPro using only the Server seems to make a difference, for the iMac, however, it doesn’t.

I really hope you find something …

Philipp

PS: What do you think about migrating this discussion to Skype?

Attachment: data_files.zip (855 KB)

PS: What do you think about migrating this discussion to Skype?

That’s fine with me. My Skype username is cstawarz. I’ll be online this afternoon, or we can set up a time to chat.

Chris

So to sum up our skype conversation and my recent findings related to the issue:

We found a workaround for the issue.

For some reasons that I don’t fully understand, the above described glitches occur only when MWorks does not have a separate graphics card to draw on. It is not sufficient to have a second monitor hooked to the same graphics card that the Mac OSX system uses, even if you don’t touch anything while MWorks runs.

If, however, MWorks does display an experiment on a second graphics card, most of the things work OK. That means that it is still problematic to overload the first graphics card (e.g. by simply expanding a stack from the dock), because then MWorks will loose some refresh cycles, even though it draws to a different card. To circumvent this problem it would be best to have the client and the server run on different machines, so that you don’t have to touch the server while it is running (note that it still needs two graphics cards).

So my test-setup now runs an experiment with 9 random dot patterns (all in all 45000 points) and one drifting grating for one minute. It is a MacPro with a G-Force GT120 as primary graphics card. It has a standard 60Hz TFT connected via DVI. This one displays the OSX dock, the server window, console and mirror window. A second graphics card (ATI Radeon HD 5870) with a precision TFT connected over DVI displays the experiment.
The Client can be any OSX computer, in the test case it was a MacBook. It connects to the server over TCP socket and provides the user interface during the experimental run. The server was never touched after the server application was started.

With this I finally have what I wanted: Rock-solid draw timings, even with a lot of load due to complex stimuli. The drawback obviously is that I need a second computer to run my experiments. This is unfortunate, but that seems to be the case with every workaround.

So even if the workaround solves the problem for me, I believe that there might be people out there that do have the glitches and the odd draw timings in their experiments as well. It feels wrong to me that one necessarily needs a second graphics card in order to not screw up the dynamic stimuli. And that even if you are able to drive up to three monitors (in case of the 5870) with one graphics card.

So to conclude here: I hope this problem can be solved in future releases of MWorks.

Thanks,
Philipp